From overhead and labor costs to daily sales and profit margins, there are so many metrics for restaurants to keep track of. In fact, it can be difficult for business owners to determine what they are, what they mean, and how to act on them.
This is why key performance indicators (KPIs) are so vital. As their name implies, KPIs are facts and figures that you can assess over time for a valuable barometer of how your business is faring overall. What are your core business objectives? If you know what your main goals are, then you can intentionally set KPIs to track progress towards them.
As a result, restaurant KPIs serve a number of important purposes:
Whether quantitative or qualitative, KPIs deliver applicable, actionable data so that you can make decisions based on information instead of intuition.
By establishing clear targets to meet — whether on a weekly, monthly, quarterly, or yearly basis — everyone on the team is aligned in their priorities.
As you determine KPIs to help optimize your business performance, you'll probably discover which parts of your operations are too costly or inefficient.
Every restaurant is unique, and which KPIs to prioritize will be based on the vision and direction for your business. But here's a rundown of common restaurant performance metrics you need to know to help you maximize profits and meet the needs of your customers and staff.
Sales and profitability KPIs
There are baseline numbers that you can compute — such as total sales, cost of goods sold, labor cost percentage, and fixed and variable costs — that can then help you calculate more advanced restaurant metrics. Use these basics to understand your prime cost, profit margins, food cost percentage, and break-even point so you can accurately gauge the health of your business.
Total sales
Your total sales are your on-premise, delivery, and pickup sales combined. DoorDash partners can find their delivery and pickup sales in the Merchant Portal, and add them to your on-premise sales. Or, with a point of sale (POS) integration, you can see all of your sales together in one place.
Total sales are generally calculated on a daily basis — although weekly, monthly, quarterly, and annual sales calculations can provide a broader overview of restaurant performance.
Total Sales = On-premise Sales + Delivery Sales + Pickup Sales
Cost of goods sold (CoGS)
Cost of goods sold is essentially how much every item on your menu costs to create. The first step to determining your CoGS is keeping track of your inventory on a monthly basis. You'll calculate CoGS using the value of your inventory at the beginning of the month, the value at the end, and any inventory purchases made during the month.
This metric should be calculated at least once per month, or whenever a large amount of goods has been purchased.
Cost of goods sold = Beginning Inventory + Purchased Inventory - Final Inventory
Fixed costs
Fixed costs are costs that generally don't change from month to month, like rent, mortgage, salaries, loan payments, license fees, or insurance premiums.
This metric is generally calculated on a monthly basis.
Variable costs
Variable costs like ingredients, hourly wages, and utilities are more likely to fluctuate from month to month, though after a while they become easier to predict depending on season or time of year.
To help identify and manage waste, many restaurants calculate variable costs each day.
Labor cost and labor cost percentage
Labor costs include salaried labor, hourly wages and other employee-related expenses like workers' compensation, benefits, taxes, and insurance. You can calculate labor cost percentage by looking at labor as a percentage of sales or as a percentage of total operating costs.
Labor cost percentage should be calculated at least each month, or every time your staff is paid.
Labor = Salaried Labor + Hourly Wages + Employee-related Expenses
Labor Cost Percentage (as a Percent of Sales) = [Labor Costs / Total Sales] x 100
Labor Cost Percentage (as a Percent of Costs) = [Labor Costs / Total Operating Costs] x 100
Prime cost
Prime cost is the amount of money it takes to run your business on a daily basis. Find it by adding together your labor costs and your cost of goods sold. Typically between 60-70% of total sales, prime cost is a helpful metric to track because it involves costs within your control, and therefore can be aligned to actionable KPIs.
Like labor cost, prime cost should be calculated monthly, or whenever a critical expenditure has been made.
Prime Cost = Labor + CoGS
Gross profit margin
Your gross profit is your total sales minus your CoGS and labor cost. Your gross profit margin is a percentage that helps you determine how efficiently you're managing your operations and sales. The higher your gross profit margin, the better. If your gross profit margin is low or negative, it may be an indication that sales need to be boosted, efficiency could be improved, or your pricing model needs some tweaking.
Generally, gross profit margin is calculated on a regular basis to monitor the financial health and profitability of the business.
Gross profit margin = [(Total Sales - CoGs - Labor)/Total Sales] x 100
Net profit margin
When people talk about profit margins, they're usually talking about net profit margins. Your net profit is your total sales minus all costs: CoGS, labor, and all other fixed and variable expenses. Your net profit margin tells you exactly what percentage of your total revenue is profit. For restaurants, net profit margins range from 0-15%, with most restaurants falling in the 2-6% range.
Profit margin can be calculated as often as desired, but it's a good idea to monitor it on a quarterly, monthly, or even weekly basis to ensure the success of your business.
Net profit margin = [(Total Sales - All Costs)/Total Sales] x 100
Food cost percentage
Your food cost percentage is the difference between how much an item costs to make and how much you are selling it for. Although this percentage will vary based on the item, this metric can help you identify which items are the most profitable. Once you know that, you can feature those items prominently on your DoorDash delivery menu.
In addition to figuring out the food cost percentage for individual items, you can also calculate the overall food cost percentage for your entire menu, which is typically somewhere between 28% and 35%.
Food cost percentage should be determined before your restaurant opens for business and revisited when costs fluctuate.
Food cost percentage = Item Cost / Selling Price
Break even
A useful metric for new and established restaurants, your break even point is how much food you have to sell each month to break even and start turning a profit.
Break even point should be calculated before you open for business, and then revisited as you establish your fixed and variable expenses.
Break even point = Total Fixed Costs / ( (Total Sales - Total Variable Costs) / Total Sales)
Customer satisfaction KPIs
The Merchant Portal on DoorDash doesn't just help restaurants monitor delivery operations. With its dashboards and reporting, as well as the Business Manager mobile app, it also grants you valuable insight into your customers' desires and behaviors when ordering pickup or delivery, which is another good source of information for goal setting.
Ratings
Customers can rate your restaurant on DoorDash, as well as a range of other ratings and review platforms such as Google and Yelp. Your average rating gives you a useful assessment of your restaurant's current reputation among customers.
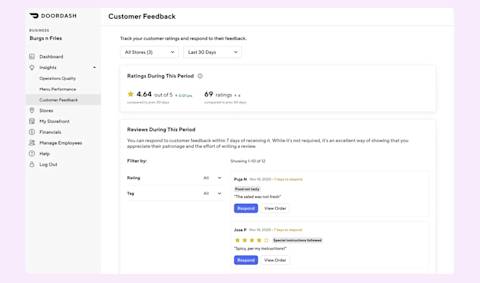
Feedback
Reading reviews provides qualitative data on what makes your restaurant stand out or what you can do to improve. DoorDash partners can use the Customer Feedback tab in the Merchant Portal Insights Hub to see what customers are saying about your restaurant. You can even reply to reviews with pre-written templates and use targeted promotions to increase customer satisfaction and loyalty.
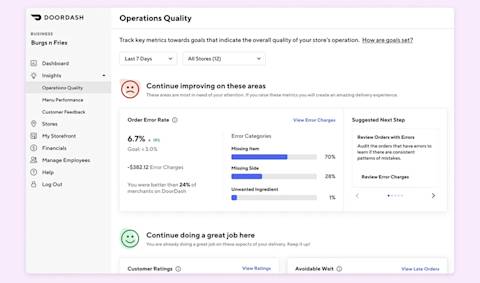
Order issues
When it comes to online ordering, what's working, and what could be better? DoorDash partners can use the Operations Quality tab in the Insights Hub to see how you're performing against operational metrics that play a large role in customer satisfaction, including cancellations, Dasher wait time, customer ratings, and order accuracy. These insights will help you implement strategies to combat inefficiencies and streamline the delivery process.
Restaurant marketing KPIs
While running your restaurant may be your main focus as a business owner, you still need to get your name out there and attract new guests. That's why marketing KPIs are another source of meaningful restaurant performance metrics.
For DoorDash partners, the Insights Hub on the Merchant Portal compiles relevant data so you can make informed decisions without having to do so much math.
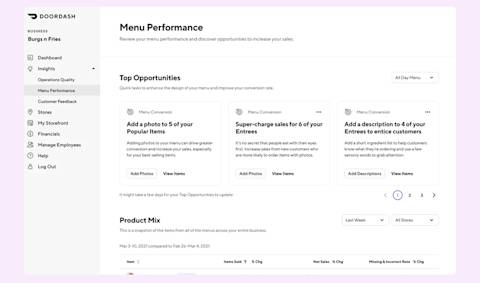
Top menu items
DoorDash partners can use the Menu Performance tab in the Insights Hub to access product mix reporting, so you can find out which items on your menu are most popular and which are bringing in the most sales. Bonus tip: You can then calculate the item's food cost percentage based on your data on inventory costs to see if there's room for improvement.
Optimizing your menu — a process also known as menu engineering — also enables you to entice new guests by capitalizing on consumer trends.
Promotions
You can launch targeted, customized promotions on the DoorDash platform, featuring incentives such as discounts, freebies, or waived delivery fees. By monitoring the number of customers who take advantage of these offerings, as well as their impact on your overall sales, you can better understand how to use promotions to support KPIs related to customer acquisition and retention.
DoorDash also lets you run loyalty programs for your restaurant, which is yet another measurable way to incentivize customer retention and sales.
Ad performance
Placing ads may be a standard part of your marketing mix, and there are different methods for measuring their performance. On DoorDash, the measurement is immediate and impactful, because you only pay for ads (known as Sponsored Listings) when it directly results in an order, instead of having to pay for all clicks and impressions.
Make the most of your restaurant metrics
All the numbers you need are there. Now it's just a matter of identifying them, monitoring them, and associating them with meaningful, measurable restaurant KPIs to inspire your goals and inform your growth.
If you're already using a POS platform like Toast or Square, that's great — you can integrate your POS with DoorDash to track on-premise and off-premise metrics side-by-side. Finally, don't forget to log in to the Merchant Portal to track menu performance, operations, and customer experience.